
Global debt has been on the rise since 2008 -- but EM corporates remain healthy
Global borrowing has risen significantly since the financial crisis. Pre-Lehman global debt stood at $178 trillion; this has grown to around $246 trillion, a staggering 320% of Global GDP.
Breaking this debt into components shows developed markets government borrowing rose from 71% of GDP pre-crisis, to 109% now. The corporate sector has seen an even more rapid growth rate, rising from 70% of global GDP pre-crisis to a record high of 92% of GDP now – and of that, it has been emerging market corporate borrowing which has grown most rapidly.
Post-crisis debt growth mainly from DM Sovereigns and EM Corporates
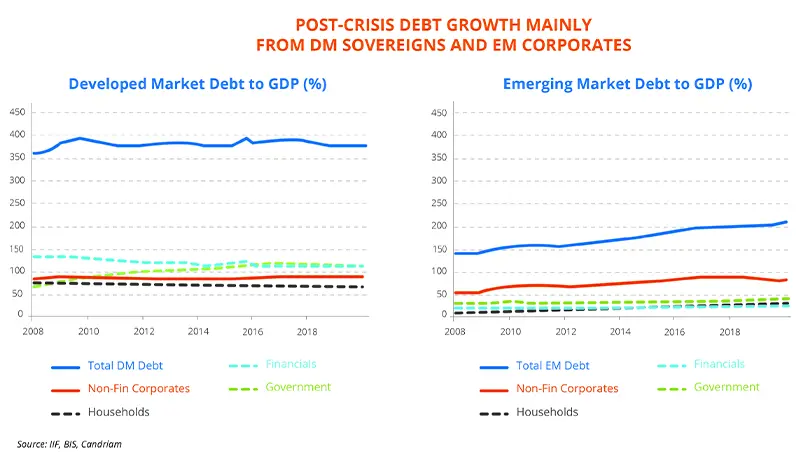
Source: IIF, BIS, Candriam
Can this Great Wall of Debt still stand? We see a bright spot in the emerging market corporates. In the post-crisis world of record low interest rates, there has been an almost insatiable demand from investors for yield, generating demand for corporate bonds. With minimal and often negative yields for DM government bonds, EM corporates are of increasing interest.
For corporate borrowers, bond issuance, when possible, can be much more attractive than bank loans. The graphs merely hint at the major change in funding patterns by global corporations. The supply of bank loans has weakened as developed market banks improved their capital ratios following the financial crisis. Figures 1A and 1B show how financials have deleveraged during this decade of rising debt. The bond market now plays a much larger role in corporate funding. Bonds offer clear advantages to corporates relative to bank borrowing, such as fixed rates instead of floating, generally longer maturities, and usually much less restrictive covenants than bank loans.
How should we view these statistics?
Emerging market external corporate debt, excluding financials, reached $1.123 trillion at the end of 2018. If bond issuances of financials are included, the external stock of emerging market corporate bonds stands at $2.7 trillion.
China has dominated this growth in EM debt. Chinese external corporate bond stock excluding financials now stands at $270 billion, or around 25% of total emerging market ex-financials.
But should we perhaps exclude China when we analyse aggregate EM figures? China has a non-bank lending market which rivals that of the US. Including financials, bank loans, domestic debt, China’s non-sovereign debt comes to a whopping $8.3 trillion, or 304% of GDP. Those are developed market types of figures. China's GDP is roughly five times that of India, and more than the GDP of India and the next ten EM nations combined. Even a tiny change in data from China skews overall EM statistics.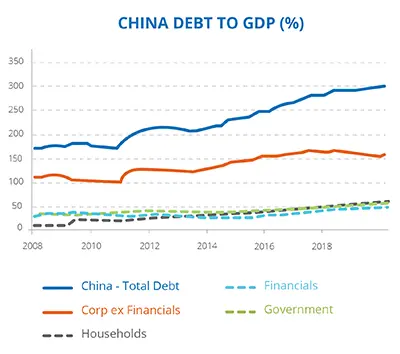
Source: IIF, BIS, Candriam
Solid credit metrics in EM corporates
As an asset class that can deliver risk-adjusted returns and diversification for portfolios, we welcome the growth in the emerging markets corporates universe.
Leverage and interest coverage ratios continue to be better for EM corporates than for equivalently-rated DM corporate issuers. We see no evidence of a broad deterioration in credit fundamentals across the larger emerging market corporate issuers, despite the rise in bond issuance. We think EM corporate debt loads ex China are comfortable, especially if rates remain low and markets remain free and open.
Emerging market economies now have better external fundamentals than they did a decade ago. They enjoy improved current accounts, larger foreign exchange reserves, and better macroeconomic buffers to weather storms in the global economy. Of course leverage increases vulnerabilities and may exacerbate downturns. A deep global recession could pressure the most highly indebted companies in both developed and emerging markets, and even create global systemic risks. For emerging market corporate issuers the largest risks would be a serious global economic slowdown, a strong surge in the USD, or a potential increase in risk aversion.
Emerging market corporate issuers have been quite proactive in pre-funding, enhancing their ability to ride out the next downturn. The Bank of International Settlements estimates that 80% of the proceeds of emerging market bond issues remain in cash 12 months post issuance. This demonstrates a prudence amongst issuers, who are building balance sheets in good times, so as not to be overly dependent on future financial market conditions for re-financing.
Currency exposure is also well managed; EM corporate issuers are actively aware of foreign exchange management when borrowing in USD. The majority generate hard currency revenues, producing natural hedges. Of the others, most have at least partial financial hedges in place, while some operate in jurisdictions where pegged currencies limit FX repayment risk.
Overall, the EM credit universe remains firmly investment grade. This is despite the notable growth globally in lower-quality ratings. The often-cited BBB segment, a significant risk in US corporate credit markets, has remained static at 40% of emerging market corporates. The B category has grown in both DM and EM, and we view this area with caution. For EM debt, the change in ratings composition over the last decade has been due to the greater access of emerging market issuers to international markets.