
Market Review
Index rebalancing strategy
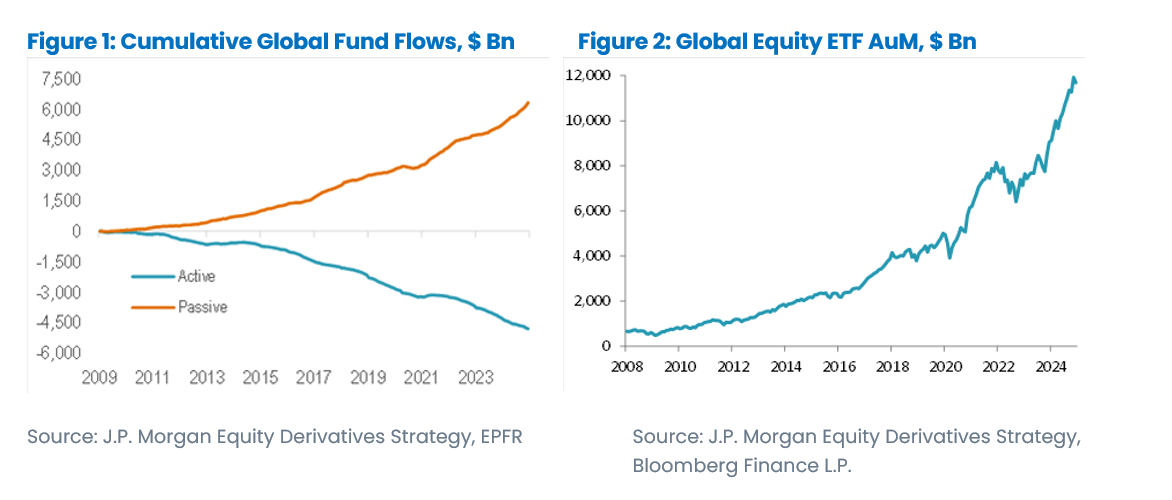
It was another record year for the passive industry with strong asset growth, with 2024 surpassing the 2021 record. Additionally, 2024 marked a significant milestone as passively-managed assets under management (AuM) surpassed actively-managed AuM, a result of several years of inflows for the former and outflows for the latter.
This ongoing structural force bodes well for the continued success of our strategy.
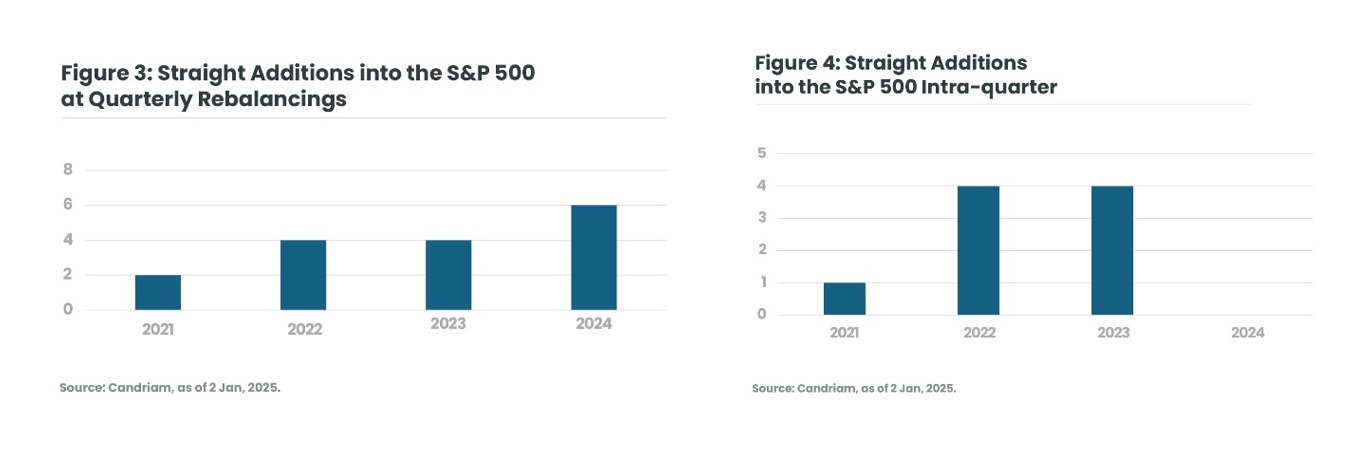
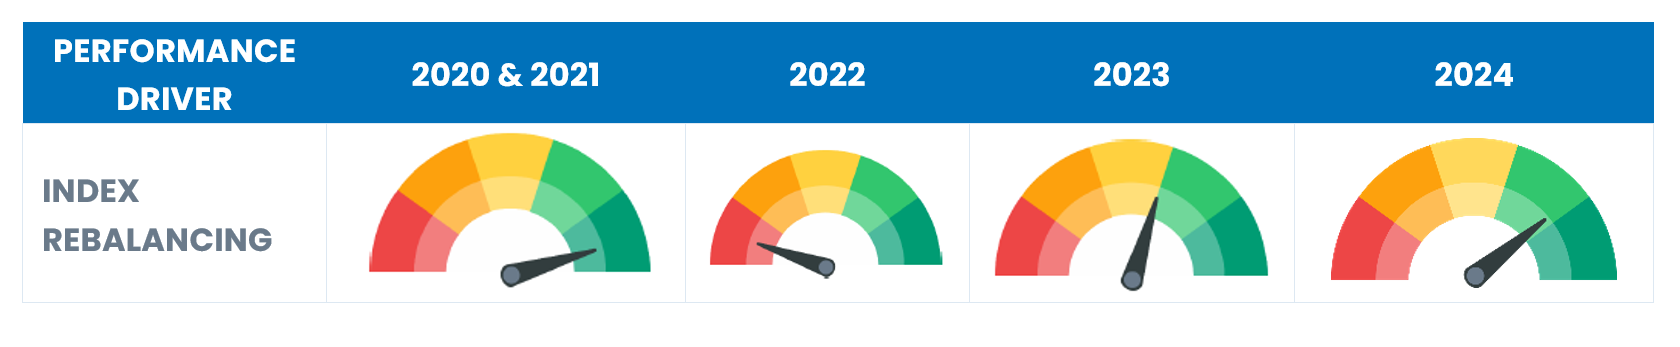
The latter part of 2024, and the year as a whole, saw our index rebalancing strategy perform well. In the second half, performance was mostly driven by the quarterly rebalancings, which saw very large turnover. Indeed, on the back of two consecutive years of AI-driven bull markets with fewer M&A transactions closing, this year has also seen a significant number of straight additions into the S&P 500 at quarterly events with no intra-quarter adjustments.
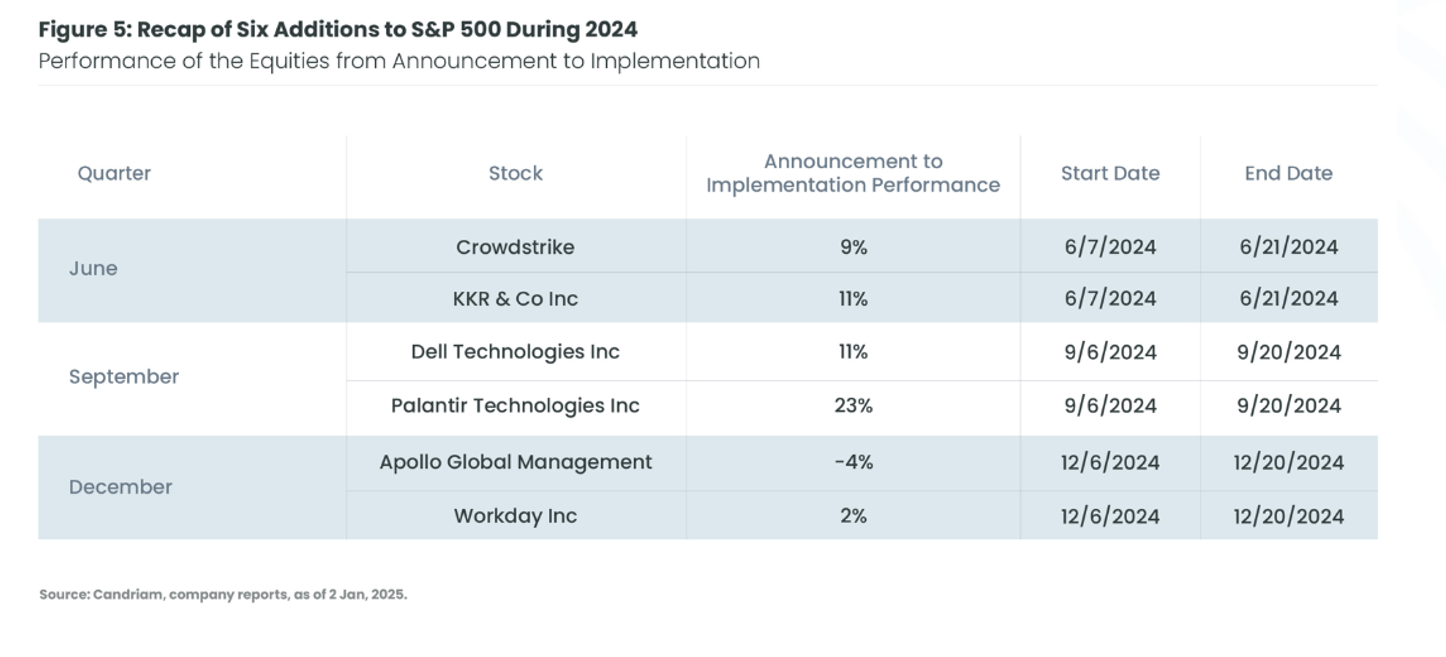
After the positive performance of the June and September straight additions, the performance following December rebalancing showed some signs of overcrowding, with negative performance from Apollo Global Management between announcement and implementation. However, our consistent approach has enabled us to generate positive returns from the rest of the trades in December.
For intra-quarter additions, as outlined in the first half flash note, activity remained rather subdued compared to the previous years. Nonetheless, notable additions to the S&P 400 included Docusign in October and the pet food company Chewy in the same month.
We are confident that the current environment is conducive to the strategy.
Relative value strategy
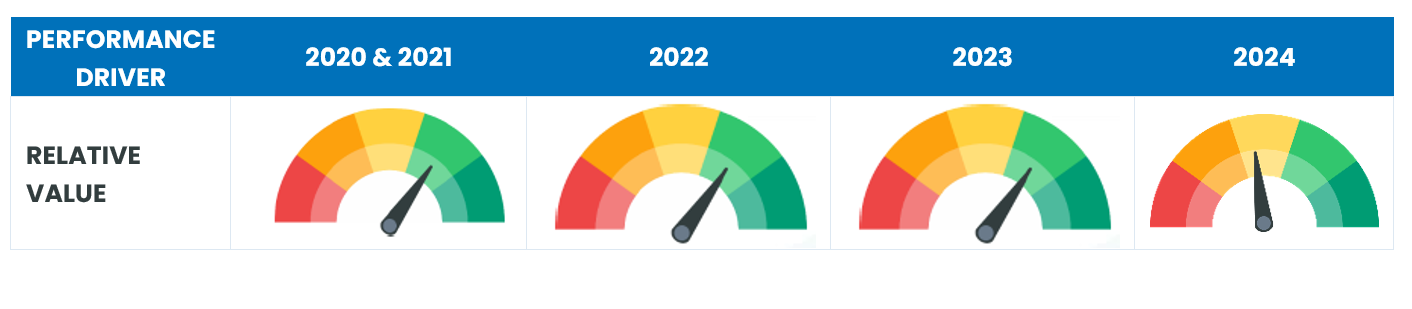
As a reminder, the relative value strategy seeks to exploit medium-term inefficiencies on valuations by adopting long positions on under-valued stocks (so-called cheap) and short positions on overvalued stocks (so-called expensive).
As outlined in the first half review note, the strategy faced challenges due to the prevailing current macroeconomic environment, characterized by the escalating valuations of the tech sectors and the sensitivity of potentially undervalued equities to the Federal Reserve’s rate cut path. Inflation figures improved and the Federal Reserve implemented rate cuts (50 bps in September, 25 bps in November), the relative value bucket faced easier conditions, however, the Fed’s hawkish stance in December exerted pressure on valuation spreads.
Analysing Long-term Valuation Distortions[1]
We believe the relative value strategy is particularly compelling in the context of distorted valuations. In Figures 6A and 6B, we show the results of a study we conducted on historical valuation spreads.
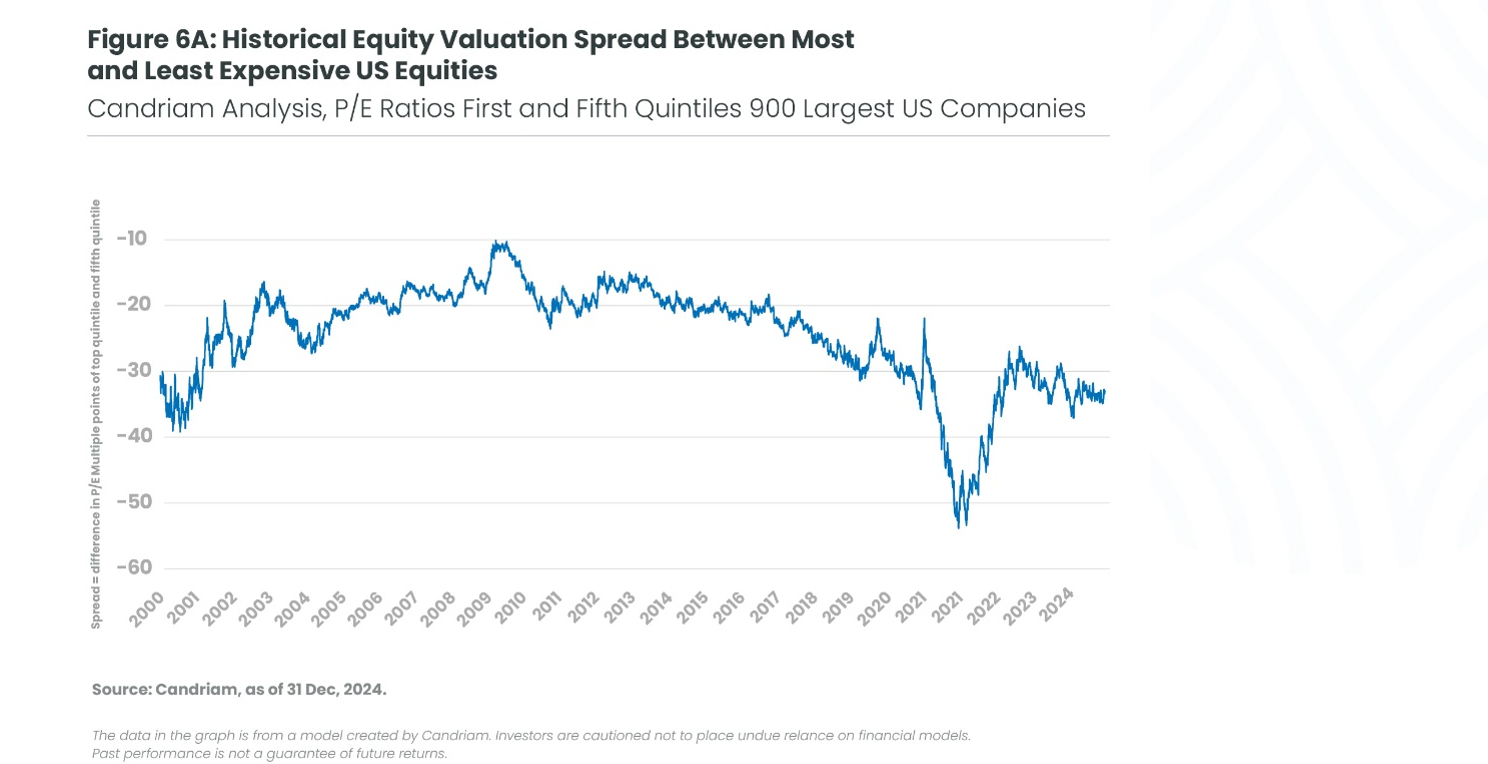
A preliminary analysis indicates that, with the exception of 2021, as we enter 2025 the spreads are at historically high levels, approaching those seen at the peak of the tech bubble in early 2000. In that instance, the high spreads were followed by strong mean reversion in the aftermath of the burst.
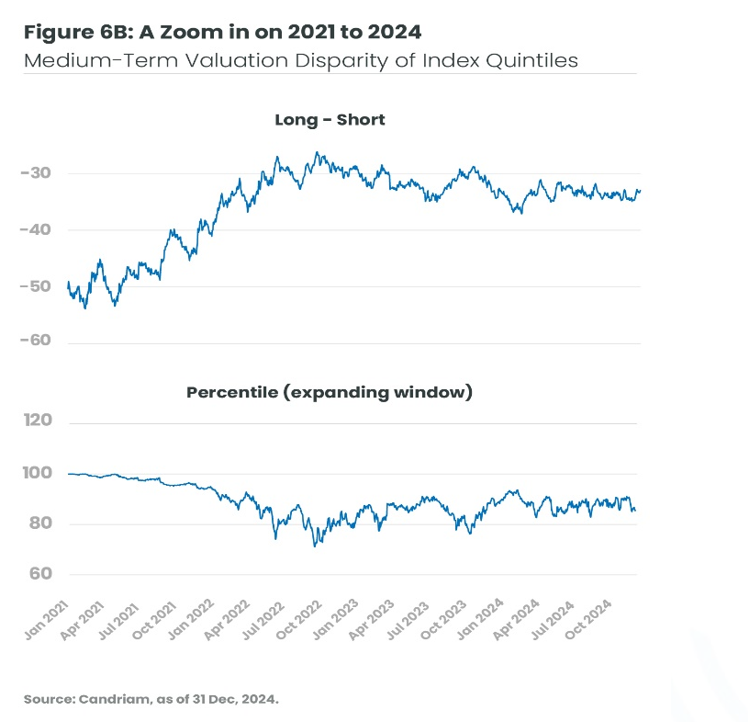
Figure 6B shows a more detailed view of the most recent four years, illustrating the corresponding percentile and expanding the graph (the left hand scale corresponds to these quintiles from year 2000, as per our study and figure 6A).
Following the record high spreads of 2021 and through late 2023, there has been significant narrowing in spreads in the study universe. During those two years, our relative value strategies contributed positively to the performance of our EMN strategy.
As Figure 6B shows, there was a widening in valuation spreads in early 2024, both in June and in late December. On many occasions spreads hit the 90th percentile bar, indicating historically large distortions.
In light of these observations, it is our firm conviction that our portfolio is well-positioned to benefit from a mean reversion on both sides of the trade.
Note: This is an ‘expanding window’. That is, the percentile shown in the graph is the percentile based on the daily data from Jan 2001 until that point (date) in the graph.
2025 Outlook
The Effect of the M&A Comeback on Indices
While 2024 saw more M&A activity than in either of the two previous years, we expect 2025 to be a good vintage in the US, buoyed by declining interest rates and a more favourable regulatory environment. Under the previous US administration, the Federal Trade Commission (FTC) Chair Lina Khan adopted a stringent approach to anti-trust issues, which lead to the termination of certain deals and deterred some companies from pursuing mergers or acquisitions. The newly-appointed Chair Andrew Ferguson vowed to lead an FTC set to “stay in its lane” following “four-year regulatory assault on American businesses”.
Consequently, we anticipate that this changing environment will have a significant impact on the number of index rebalancings and provide us with more numerous intra-quarter, ad-hoc rebalancing opportunities to arbitrage.
New Year, New Rules?
The year 2024 saw a significant number of index providers initiate consultations regarding their rules.
We describe some of the consultations that could have interesting impacts on the trade in some key themes:
Reduce Concentration Within Indices
A major theme for 2024 has been concentration on the back of a large and momentum-driven large tech component.
Following positive feedback from market participants, FTSE Russell index provider decided to implement a capping methodology on its US style indices effective March 2025. [2]Specifically, the Russell 1000 Growth Index suffers from concentration issues, which should be corrected by the new methodology, similar to the Nasdaq Special rebalancing of 2023.
While the flows may vary before the implementation, we expect very large selling flows on some of the ‘Magnificent 7’ names such as Nvidia, Apple, Microsoft, Google and Amazon.[3]
This change of rules is also similar to what S&P did in September when they changed the capping rules of their indices, an action which had an immediate impact on the Technology Select Sector.
Increase the Number of Recurring Rebalancing Events
Following a 15-month consultation, FTSE Russell has announced a change to the timing of its Annual Reconstitution. This is usually the largest liquidity event of the year, and from 2026, it will be implemented semi-annually. The June date will remain and the other reconstitution, will take place at the end of November.
The decision follows concerns with the disproportionate size of the reconstitution resulting from the current method, and initial calculations by Russell indicate that the sum of the turnovers of two reconstitutions will exceed the current annual turnover.
Further down the line, we expect this change will have a very positive effect on trading, creating more arbitrage opportunities for the strategy.
More Opportunities Stemming from Company Domiciliation
Finally, while 2023 and 2024 were marked by de-listings from Europe to the US, 2025 could see a novel development in the area of multiple company listings.
To tackle the European exodus, the UK FCA (Financial Conduct Authority) launched a consultation to change their listing structure and simplify FTSE eligibility. In October, Coca-Cola Europacific Partners applied for a commercial license, a move that could result in a nationality change for the company under the FTSE rules. Subject to sufficient liquidity, the company may be added to the FTSE 100 index in March. The company would then be part of both FTSE and Nasdaq 100 indices
[1] We briefly describe the methodology of the study shown in Figures 6A and 6B :
- Based on a universe composed of US large and mid-cap companies, we constructed two types of portfolios based on their Price to Earnings (P/E) ratios:
- ‘Cheap’ group of equities : 20% of the universe with the lowest P/E
- Expensive’ group of equities : 20% of the universe with the highest P/E
- The model portfolios are rebalanced monthly.
- We analysed the difference between the median P/E for the ‘cheap portfolio’ and median P/E of the ‘expensive portfolio’ since 2000.
[2] Source: FTSE Russell Capping Methodology
[3] The names of companies mentioned here are provided for illustrative purposes only.